Posts

Showing posts from July, 2023

High Pitch Momentum Set Up Can You Understand ?
Image
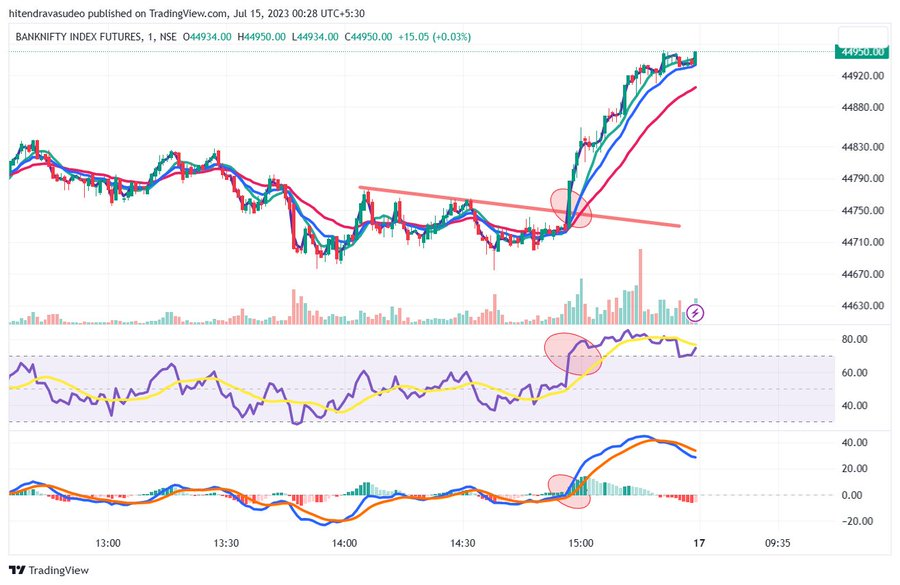
 High Pitch Momentum Set Up Can You Understand?   NIFTY and BANK NIFTY Movement is becoming Crunchy. Volatility has been for falling every day, every week, every month and for last couple of years. At point of time Annualized Volatility was over 30 and today Nifty Annualized Volatility is 16.60. Daily Annualized Volatility is now 0.87 which squeezed movement regularly with occasional spike, but it dies out back to falling manner. As a result of which purely intra-day traders may have to look for various time frame to get into movement to get directional movement very early. In current context may have to use 3 min and 1 min charts. New Trend always start from Oversold and Overbought conditions. or from Positive/Negative Divergence on indicators. By default, we talk and indicator RSI. Other indicators can be used with similar logic. Further trader can user Traditional Pivot Levels Standard as Developed by Wilder. R1-R2-R3 and S1-S2-S3 to be used. In Conjunction with the overbou...

Options Sells Why ?

Image
                                                         BANK NIFTY  44700 CALL 27th JULY 2023 Red Candle is because Open Interest Increased with the fall and negative candle which indicates addition of short position on EOD. In such situation objective remains to exit long and sell on last close or above or at R1 or above keeping in mind 2 days highest high as the stop loss. If at closing time after 3.00 pm or later if price is above the 2 days high, then enter long. Try at 3.15 or later or last few minutes closing time. When Green is seen on the chart. Open Interest increased with the rise and positive candle which indicates addition of long position. Plugin for the same is available can be contract for MS users.

SENSEX breakout on Weekly

Image
  Sensex after negative divergence on daily chart profits the breakout on weekly chart. Negative Divergence on Daily lead to consolidation without breaking key support of 62300. At a point it looks might break it but did not. Consolidation continued for eventual breakout. Price and Time Relationship are shown in the chart. As long as 62800 is not violated expect the Sensex to move higher. Even if it violates then correction will be intermediate short to medium term for creating higher bottom. Any Daily or Weekly oversold will be next best opportunity for long term and passive investors.