High Pitch Momentum Set Up Can You Understand ?
High Pitch Momentum Set Up Can You Understand?
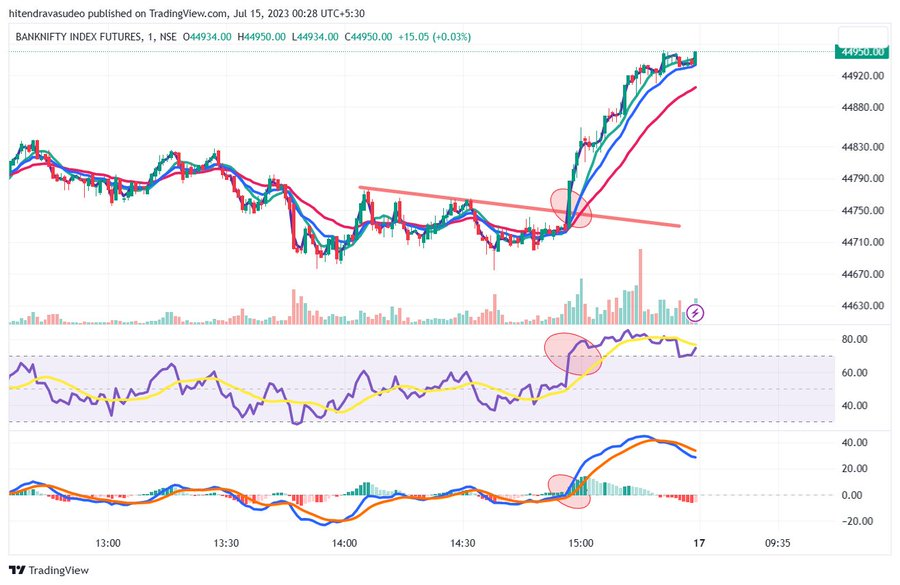
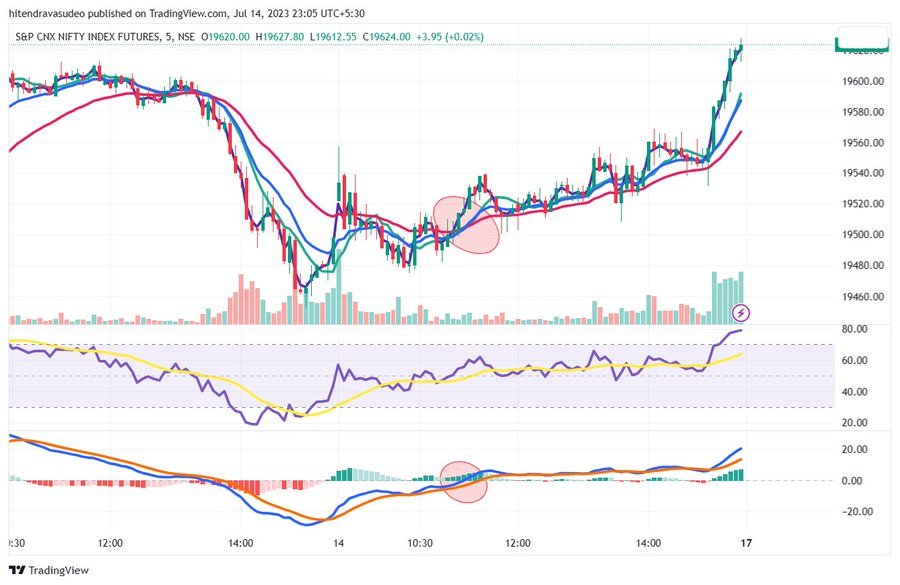
NIFTY and BANK NIFTY
Movement is becoming Crunchy.
Volatility has been for falling every day, every week, every month and for last couple of years.
At point of time Annualized Volatility was over 30 and today Nifty Annualized Volatility is 16.60.
Daily Annualized Volatility is now 0.87 which squeezed movement regularly with occasional spike, but it dies out back to falling manner.
As a result of which purely intra-day traders may have to look for various time frame to get into movement to get directional movement very early.
In current context may have to use 3 min and 1 min charts.
New Trend always start from Oversold and Overbought conditions.
or from Positive/Negative Divergence on indicators.
By default, we talk and indicator RSI. Other indicators can be used with similar logic.
Further trader can user Traditional Pivot Levels Standard as Developed by Wilder.
R1-R2-R3 and S1-S2-S3 to be used.
In Conjunction with the overbought and oversold.
Further Lagging Indicator confirming the reversal.
Dow Theory - Reversal Concept needs to be applied. Identify Lower top post oversold and post positive divergence.
FOR HIGH PITCH MOMENTUM
RSI enter overbought zone and Lagging confirms in 2 ways. Lagging Crosses Zero line and Lagging Crosses it averages.
The same can be applied to various timing.
Keep flipping time frames.
Keep managing risk well.


Comments
Post a Comment