Posts

Showing posts with the label Bank Nifty

High Pitch Momentum Set Up Can You Understand ?
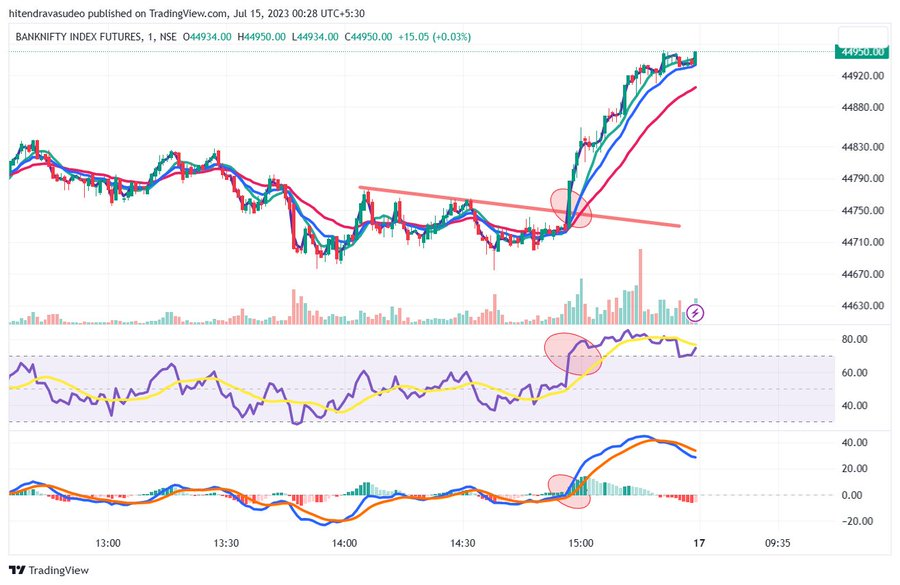
Image
 High Pitch Momentum Set Up Can You Understand?   NIFTY and BANK NIFTY Movement is becoming Crunchy. Volatility has been for falling every day, every week, every month and for last couple of years. At point of time Annualized Volatility was over 30 and today Nifty Annualized Volatility is 16.60. Daily Annualized Volatility is now 0.87 which squeezed movement regularly with occasional spike, but it dies out back to falling manner. As a result of which purely intra-day traders may have to look for various time frame to get into movement to get directional movement very early. In current context may have to use 3 min and 1 min charts. New Trend always start from Oversold and Overbought conditions. or from Positive/Negative Divergence on indicators. By default, we talk and indicator RSI. Other indicators can be used with similar logic. Further trader can user Traditional Pivot Levels Standard as Developed by Wilder. R1-R2-R3 and S1-S2-S3 to be used. In Conjunction with the overbou...

BNF JUNE AND JULY

Image
  Critical Structure in current uptrend which is more showing a corrective structure on the up move.

BNF holding STD CHANNEL

Image
  BNF JUNE Contract BNF had a spike open on 22/05/2023. Ignore the spike open and high. Consider the high of 29/05/2023 as the high of the current rising phase. The high formed on 29/05/2023 is 44525. A rising 1 St. Deviation Channel has been drawn on the price chart. The channel has been held and created support at 43861 and 43455. The low of 43455 is the higher bottom of the current phase and 43455 as the trading higher bottom. The demand zone created by 43455 is 43796-43455. A fall and close below 43861 with bearish large candle can mark the high of 44525 an intermediate swing top. This could lead down for correction to test 43455,43000 and 42800. The higher top and higher bottom formation is still in place. Further rally is above the breakout above 44525. Traders long and holding the same may keep 43861 as downside trigger to protect long position. Down trigger is 43861 if closes with bearish candle.

BNF appearance like falling wedge.

Image
 Dated 30/03/2023. BNF appears to show falling wedge and to be confirmed if sustains above 39957 and provide further breakout above 40273. It must also not fall below 39348. Further consolidation has to be above 39348 in order to provide the breakout above 40273. Subsequently could scale up to the gap for resistance. Resistance gap is at 41050-41368. If breakout is successful, then expect rise towards to resistance gap.