MICRO CAP- TREND AND RS

Weekly indices table. check trend date, check trend start price and gains. as per weekly dynamic trend.
WRV
weekly reversal value
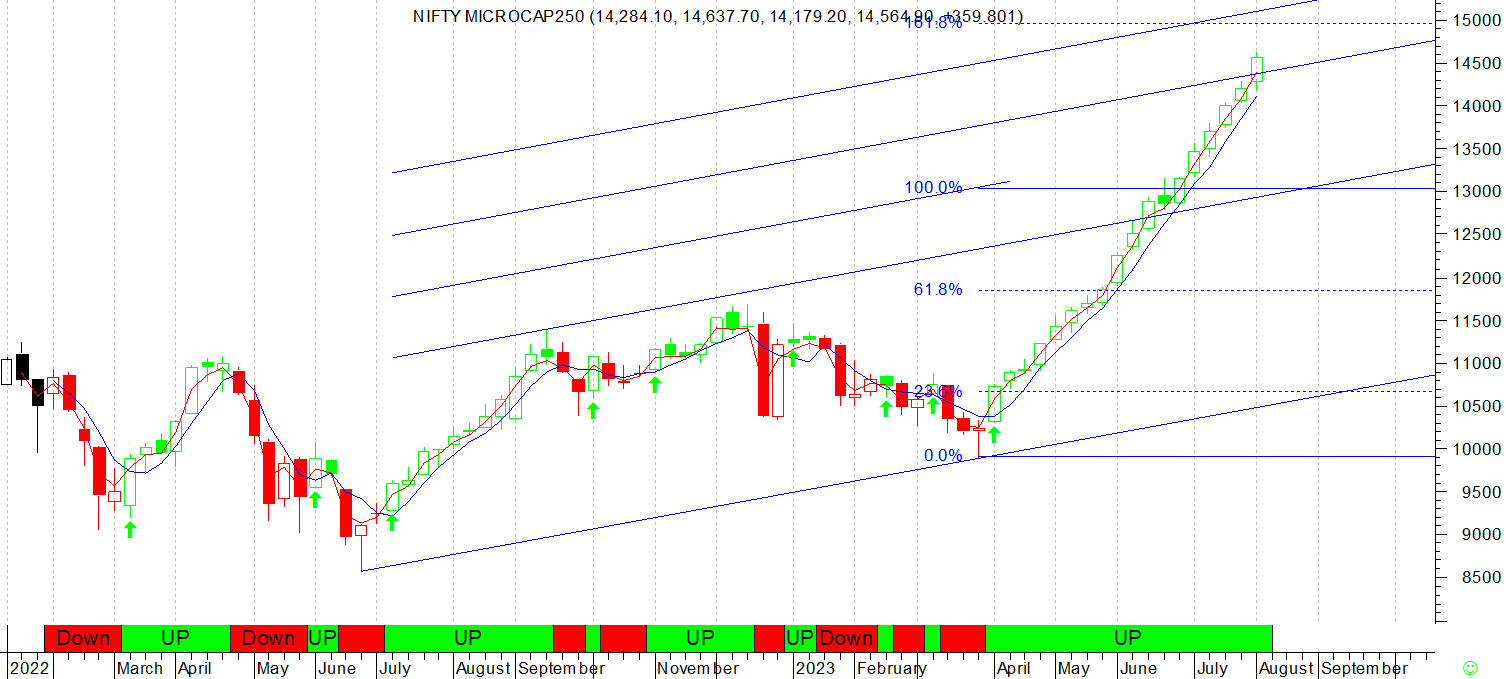
If trend up and can turn down if friday close is below WRV - 90% of the time
since this is weekly chart
reversal of hour, daily always does not translate into weekly reversal value.

this is higher low and higher high on weekly
every week higher low and higher high
green dot
last week candle was also bullish. positive candle even as NIFTY TOTAL MARKET index should dip and neutral candle.
risk is given.
last column where it is how far it is from WRV
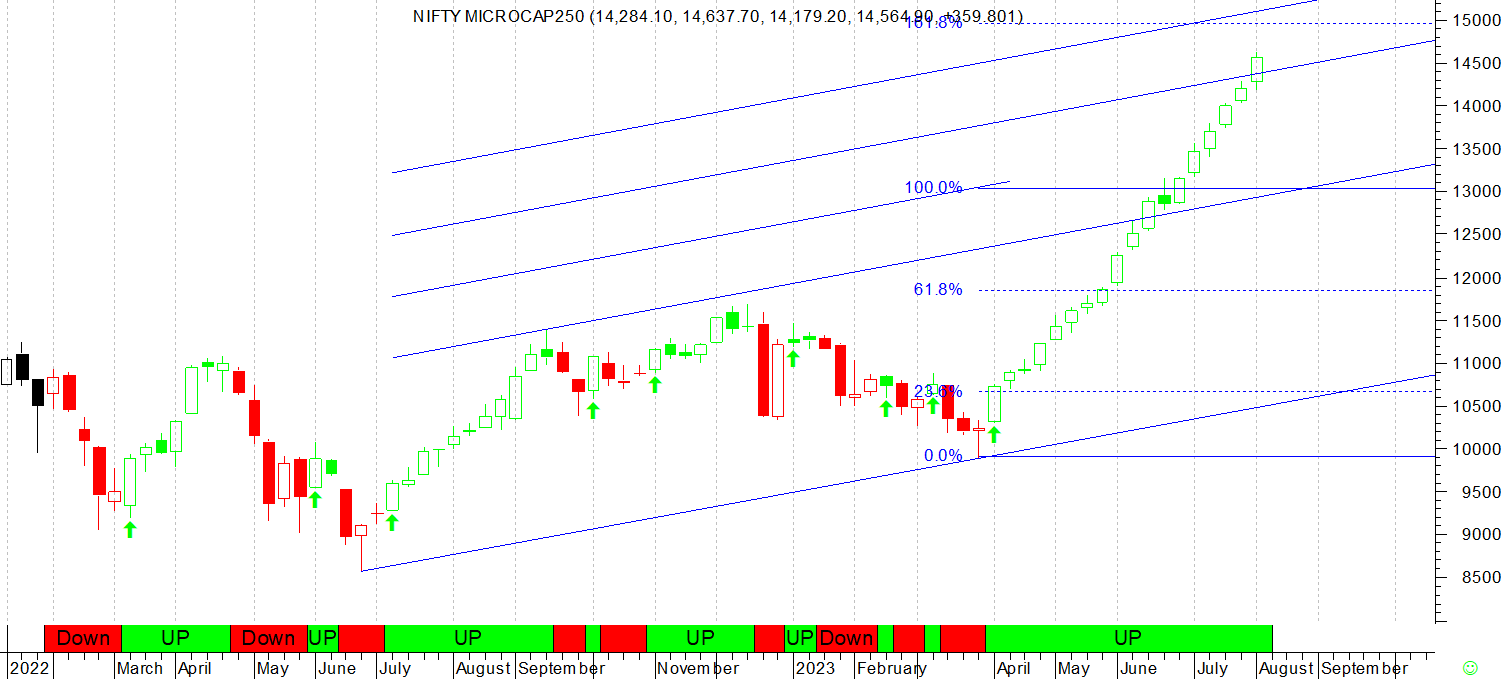
this is weekly dynamic trend color. green because WRV trend is up
red and blue decides the trend
in correction market its will be oscillation that gives idea that it is correction market or pullback volatility market
these are back bone of analysis.
later all other modes of analysis as to be applied as required.
RS helps to filter further.
to select or not select
when new signals come

for example this table as per our weekly dynamic trend new signal
RS is sorted in descending order on new cross over
of red and blue line
for example

this stock
new buy signal
we also have given fundamental rating in this table
2/3
so new signal, RS sorting and fundament score
new next job once selected is to hold as long as trend is up
we don't decide and think of what will happen.
related to this we have product.

fresh one buy week and follow up
further based on some query.
we have started to build the basket of the new addition
the reason being if some one bought and not taken action
of exit
then whenever next buy comes at lower levels one need to add again
and keep taking action to remain focused.
in correction trend will be choppy
and may not show results that time RS will help to spot. weakness as we decide only RS > 55 and then we look at chart which to take and which not to take.

from these signals we selected one

under this
so starting point becomes this stock Hindcon
and next week will go in follow up


so at this point
one has to take action
if you dont in thinking it will work or not work
then opportunity can be missed. we also have overall market understanding developed as we track market day in and day out
as already mentioned in training time and later. broad market mid cap small cap and micra cap will have a fortune in time to come. the same is happening
so say we may take few minutes based on observation
but it take time and one need to go through motion of the market
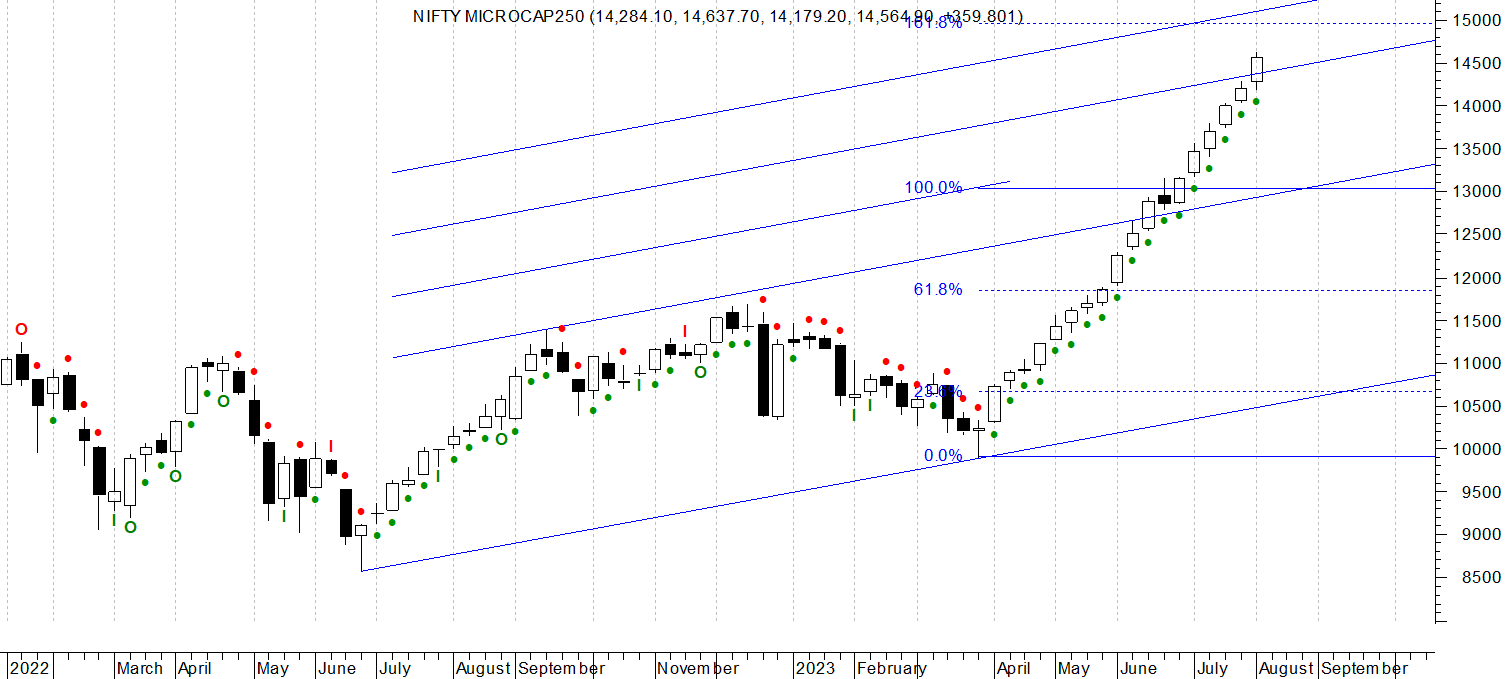
therefore, last time i indicated to buy MCAP 150 Kotak etf

in this we have shown internal and external retracement. which opportunity in accumulation zone. and upper -61.8 and -161.8 giving target

by nov 23 could be at the next upper target
and must remain above the -61.8% show hence forth even as correction sets in. because then we will an internal retracement again.
of the last corresponding rise of green if that happen
These is example of how analysis can be done.
Lay down argument, proposition and observation before taking any decision.
How data statistics can help to take decisions.
Charts are graphical representation of price giving pictorial effect for plan of action irrespective of MTM.
At time goes into observation precision can be improved.
After understanding market behavior in total in context of macro and micro movement of market and stocks.


Comments
Post a Comment