Posts

Oversold /Overbought

Image
 In oversold- on any time frame. Sentiment are weak. Fear. Market in doldrums. mindset. Feeling of unlikely to recover - deeper deeper levels- pessimistic mindset develops In Oversold drag continues down. Later develop positive divergence and still some drag down till reversal is not witnessed by lower top cross over Oversold on hourly oversold happens frequently. Oversold Daily may be once in 2-3 months Oversold and Oversold Exit becomes opportunity. In Oversold good to get ETF or index based stock. In Oversold Exit good for trading pullback or new trend in that time frame Overbought is euphoria and over optimism. Generally, lead to fall towards oversold. 

SENSEX

Image
 

BNF Channel View

Image
 

NF BY_MAY'27

Image
 https://in.tradingview.com/chart/NIFTY1!/3WxwBOKy-NIFTY-Potential/3WxwBOKy If it is A-B-C or 1-2-3-4-5 from March 20 low, NF cold be heading towards 35K by May'27 with volatility and intermediate structure of troughs and peaks 26K by OCT'24 Possible 35K between OCT'25-MAY'27 Intermediate structure can change on its progress to higher levels. Therefore, daily and weekly Oversold on RSI whenever happens could be opportunity.

Near term to Short Term Negative Divergences

Image
  NIFTY MICRO CAP 250. at critical point Currently 18900 is critical by the end of the week it has been tested fall and close today or by end of the week can extend the correction to 16814 cmp-19097 Daily chart RSI nearing oversold Dynamic Trend and Lagging Trend currently down therefore support is under pressure. hourly chart of NIFTY MICROCAP 250 in oversold NIFTY MICROCAP 250 morning high crossed on closing time then could be pullback resuming for micro-cap. under performance seen in micro-cap. small cap market RS dropped sharply. if the recovery has to happen then now in 1-2 days for scap  NIFTY TOTAL MARKET INDEX pattern on hourly not encouraging could be bearish breakdown. recovery from low seen in NIFTY TOTAL MARKET INDEX. RISING WEDGE A BEARISH PATTERN only pullback surely objective is to book profits apart from intra-day trading of up and down or 1-2 day trading of up and down Negative Divergence also well in place for NIFTY TOTAL MARKET INDEX

Averages Sync with Breakout

Image
  Averages Sync for UP trend on daily chart. Attempt for breakout from the wider sideways range denoted by the purple lines. Volatility will be a function of lower time frame in comparison to the chart time frame which we are watching. since breakout does not happen in vertical line most of the time. Therefore, when we look at the lower time frame chart it will be associated with oversold and overbought to understand the volatility if higher trend breakout is visible then look for a point from where it can fail the support and trading higher bottom Our rules of open will always help to be in track with market and in line with market

Candles, RSI, MACD

Image
  Inverted Hammer Dark Cloud Cover RSI Overbought RSI below its Average MACD Below it Average What can save it from here on is immediate breakout and close above the peak. As long as peak is not crossed expect correction. Correction can be in terms of time and price. Time Correction will exhibit by Volatility along with development of Range. The range at times can get into compression mode. Correction in terms of Price is associated with retracement to the last corresponding rise test the Fib-retracement levels of the rise.

Classic Case: Candle, Trend, Strength and Momentum

Image
  MS PLUGING Inverted Hammer Overbought Exit RSI below is average. MACD below its Average

Strength Base

Image
  daily chart. If you are passive investors. then all oversold. on daily, weekly, monthly are opportunity to invest with waiting and gestation period irrespective of MTM Because when various momentum based signal will be only when trend is established. Various momentum-based signals are available.  Now we have seen a historical breakout again with RS MODEL signal. RS Model Signal is outperformance signal in 6 months over benchmark with trend and momentum is established. for momentum based. trend line breakout and green bar at breakout 

Momentum Base Strength Base

Image
  For investing momentum if fails then later used oversold whenever it comes for accumulation especially index-based stocks. reliance also had sideways consolidation phase since October 2021 Upside retracement shown in chart dotted at higher level for potential target for passive investors who can play both  with money and holding capacity can trade and when oversold comes add. play for higher target as shown give time it will be eventually a winner. since this is Index based stock who are heavy weight

NF AND BNF DURING MARKET TIME

Image
 

Classic Example how negative news creates opportunity

Image
  The above chart is a classic example of how a negative news creates opportunity for investment. RSI oversold with heavy volumes is for accumulation. Subsequently swing bottom confirms the end of correction or pause of correction or fall. Then Dow Theory reversal confirms the end of fall and major reversal. Now the stock is approaching int the breakdown down zone that was seen few months back. RSI in overbought zone and price resistance zone of the earlier breakdown candle. Those accumulate in absolute panic opportunity created and indicated by RSI now get opportunity to book profits. A spike could happen for better higher price. Momentum on daily chart see can extend to purple line. The objective to showing the example is how negative news flows create opportunity. based on charts and its indicators structure/concepts.

MICRO CAP- TREND AND RS

Image
  Weekly indices table. check trend date, check trend start price and gains. as per weekly dynamic trend. WRV weekly reversal value If trend up and can turn down if friday close is below WRV - 90% of the time since this is weekly chart reversal of hour, daily always does not translate into weekly reversal value. this is higher low and higher high on weekly every week higher low and higher high green dot last week candle was also bullish. positive candle even as NIFTY TOTAL MARKET index should dip and neutral candle. risk is given. last column where it is how far it is from WRV this is weekly dynamic trend color. green because WRV trend is up red and blue decides the trend in correction market its will be oscillation that gives idea that it is correction market or pullback volatility market these are back bone of analysis. later all other modes of analysis as to be applied as required.  RS helps to filter further. to select or not select when new signals come for example this t...

NF and BNF observations

Image
  NF and BNF Observations Trend line support held at closing. Yesterday was In Bar above the trend line. Pullback towards the red line resistance gap. Higher low and higher high seen on Monday over Friday then expect swing bottom for pullback attempt to the resistance gap. The resistance of 2-day high is 19647 and then the gap of 19760-19812. Support will be at 19468-19390. On fall and close below 19390 with bearish candle expect the lower gaps to be tested. Lower Gaps-19302-19261, 19082-18966 and 18845-18811 Dynamic Trend- Red Color- Down Trend. Diamond on red color is minor intra-day pullback. On Green candle are minor correction in up trend. BNF dynamic trend down. Friday was higher low and higher high but candle not convincing therefore need another higher low and higher high with bullish candle.  Therefore diamond. Further selling is below 44875. From trading point of view objective can be to cover short at S1-44672 - from cmp-45001 to 44672. R1-R2(R3) to be tested-45279-...

High Pitch Momentum Set Up Can You Understand ?

Image
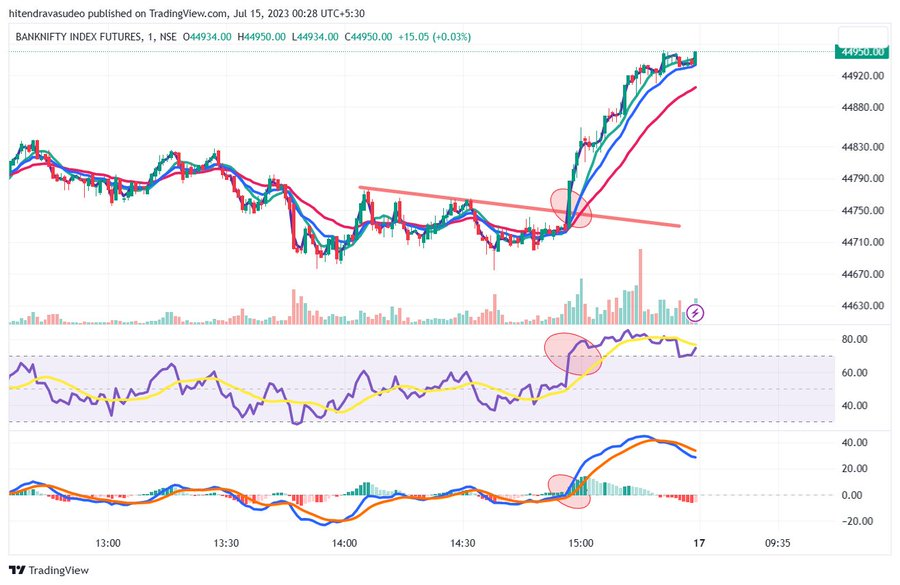
 High Pitch Momentum Set Up Can You Understand?   NIFTY and BANK NIFTY Movement is becoming Crunchy. Volatility has been for falling every day, every week, every month and for last couple of years. At point of time Annualized Volatility was over 30 and today Nifty Annualized Volatility is 16.60. Daily Annualized Volatility is now 0.87 which squeezed movement regularly with occasional spike, but it dies out back to falling manner. As a result of which purely intra-day traders may have to look for various time frame to get into movement to get directional movement very early. In current context may have to use 3 min and 1 min charts. New Trend always start from Oversold and Overbought conditions. or from Positive/Negative Divergence on indicators. By default, we talk and indicator RSI. Other indicators can be used with similar logic. Further trader can user Traditional Pivot Levels Standard as Developed by Wilder. R1-R2-R3 and S1-S2-S3 to be used. In Conjunction with the overbou...

Options Sells Why ?

Image
                                                         BANK NIFTY  44700 CALL 27th JULY 2023 Red Candle is because Open Interest Increased with the fall and negative candle which indicates addition of short position on EOD. In such situation objective remains to exit long and sell on last close or above or at R1 or above keeping in mind 2 days highest high as the stop loss. If at closing time after 3.00 pm or later if price is above the 2 days high, then enter long. Try at 3.15 or later or last few minutes closing time. When Green is seen on the chart. Open Interest increased with the rise and positive candle which indicates addition of long position. Plugin for the same is available can be contract for MS users.